Choosing solar power for home in 2026 starts with your roof, electricity use, and need for backup. Seven options may look similar in polished quotes. Their costs, flexibility, and ownership terms can differ sharply.
Berkeley Lab’s Tracking the Sun 2024 report found a median U.S. residential installation price of $3.15 per watt in 2023, before incentives. Treat that as a benchmark, not a promise. Local labor, roof repairs, equipment, and financing can change your actual quote. SEIA and Wood Mackenzie reported that solar made up 64% of new U.S. electricity-generating capacity added during the first three quarters of 2024. Adoption is growing, but the right setup still depends on the household.
This guide compares grid-tied panels, battery-ready systems, hybrid inverters, solar leases, power purchase agreements, community solar, and off-grid designs. Some options lower upfront costs; others offer more control or backup power. A tidy ranking can hide a messy truth: the cheapest quote may not suit your roof or evening energy use. Check production estimates, warranty terms, and what happens when equipment needs service. Real savings vary.
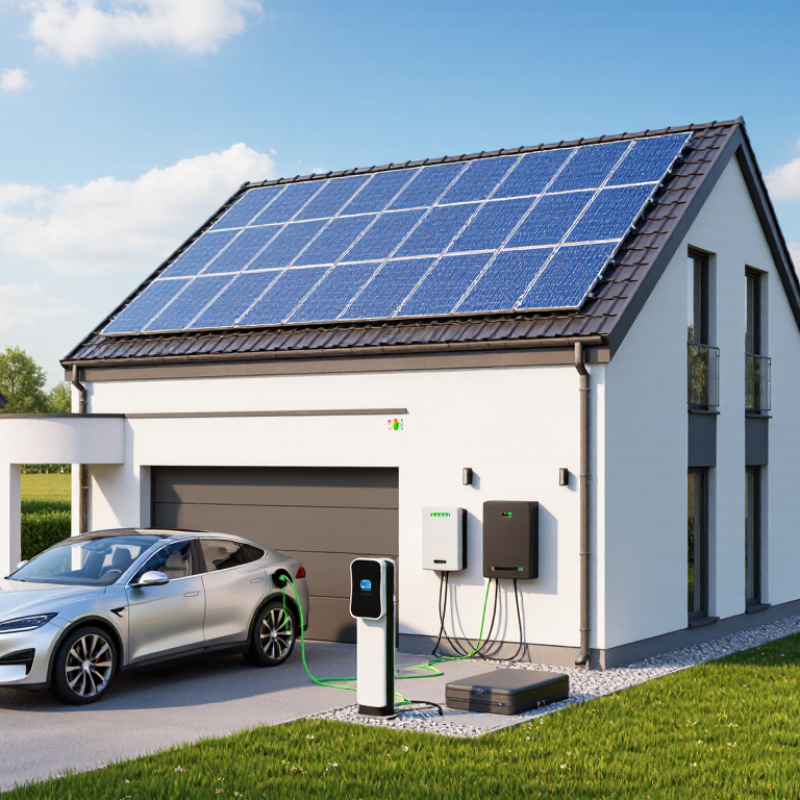
7 Best Solar Power for Home Options in 2026?
Measure Demand Against EIA’s 10,791 kWh U.S. Home Average
Choosing a home solar setup starts with your actual electricity use, not a headline system size. The U.S. Energy Information Administration reported average residential consumption of 10,791 kWh per customer in 2022. That equals about 29.6 kWh per day. It is a useful yardstick, not a promise about your household. A home with electric heating, an older refrigerator, or an electric vehicle may use much more.
Compare rooftop panels, ground-mounted systems, solar shingles, and community solar against your annual demand and available space. The National Renewable Energy Laboratory’s PVWatts tool estimates solar production using location and system details. Its estimates can help compare options, but shade, roof direction, weather, and equipment losses affect real output. A 7-kW system in one region may not produce the same annual energy as one elsewhere. That difference is easy to overlook.
Tips: Gather twelve months of utility bills and note seasonal peaks. Ask for estimated annual production, not just panel capacity. Check how the estimate accounts for shade and system losses. Be cautious: a neat average can hide a messy household pattern.
Annual household electricity use, in kWh. The 10,791 kWh benchmark is the EIA-reported U.S. home average; the other values are calculated planning scenarios from 70% to 130% of that benchmark.
Use your household’s actual annual usage to estimate solar needs. These bars show electricity demand scenarios, not solar-system production or product performance.
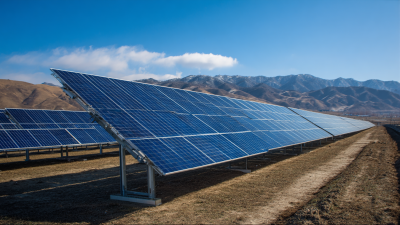
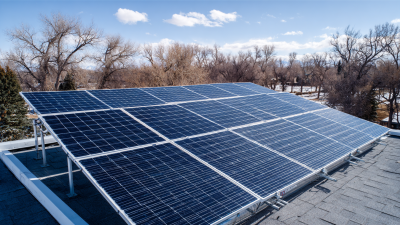
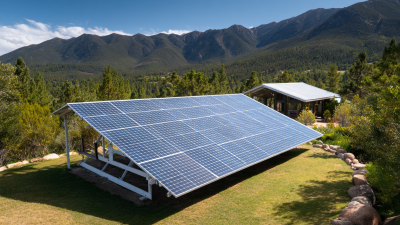
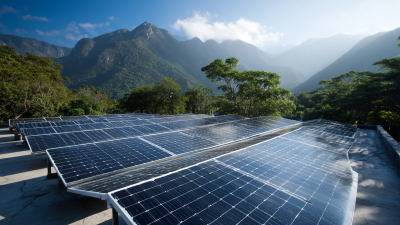
Choosing home solar in 2026 starts with the site, not a sales estimate. Roof-mounted panels use existing space, but shade, roof age, and orientation affect output. A qualified installer should assess these conditions before estimating savings. Ground-mounted systems need clear land and more installation work, yet their tilt can be easier to optimize. Solar shingles blend into a roof, though they may cost more and suit some roof projects better than others.
Portable panels are useful for small loads, trips, or backup charging, but they rarely power an entire home. Hybrid systems pair solar with batteries and the grid, helping shift stored energy into evening hours. Battery capacity matters: a system sized for lights and a refrigerator may not run heating equipment for long.
Off-grid setups need careful load planning, substantial storage, and a backup plan for cloudy stretches. It gets demanding.
Shared solar lets households benefit from a larger off-site project, where available. It can suit renters or homes with shaded roofs, but subscription terms and bill credits vary.
Compare equipment, installation scope, warranties, expected production, and total costs—not just panel ratings. Real output changes with weather and maintenance. I would also leave room for uncertainty; a neat estimate cannot capture every winter week.
Module efficiency measures how much sunlight a panel converts into electricity under standard test conditions. Many mainstream residential panels now fall between 20% and 23%. That is a useful range, not a guarantee of household output. A 22% module does not automatically produce more electricity than every 20% model.
Efficiency matters most when roof space is limited. For example, a compact roof with a chimney and two shaded corners may benefit from panels that produce more power per square meter. On a large, clear roof, a lower-efficiency option may still meet the home’s needs. Look at the panel’s rated wattage and dimensions together, rather than comparing percentages alone.
Real roofs are less tidy than laboratory tests. Heat, dust, partial shade, roof direction, and installation quality all affect production. Ask for estimates based on your roof’s layout and local weather, and check how output is expected to change over time. Small differences matter. I would also leave room for uncertainty: estimates are forecasts, not promises, and unusually hot afternoons can reduce panel performance even under bright skies.
Choosing among home solar options in 2026 should start with a production estimate, not a panel wattage claim. NREL’s PVWatts calculator uses location, system capacity, roof tilt, direction, and estimated losses to estimate annual electricity output. Entering a town or ZIP code gives a useful first pass; a roof survey can provide more detail. The same-sized system may produce different amounts in a sunny inland area and a cloudy coastal one. Weather patterns matter.
Use realistic settings. Match the array direction and slope to the roof, then test reasonable system losses instead of assuming ideal conditions. PVWatts shows monthly and annual estimates, so check winter dips and summer peaks, not just the headline total. Compare the estimate with twelve months of utility bills to see how much demand solar might cover. Ask a qualified installer to check shade from trees, chimneys, and nearby buildings. The calculator is not a roof inspection, and its estimate is not a guarantee. Not a promise. Even careful inputs can miss local shade or unusual weather. Treat the result as a planning baseline, and revise it when measured roof details become available.
These seven residential system examples pair typical home-use scenarios with representative U.S. locations. Annual generation is an approximate planning estimate calculated as system capacity multiplied by the location’s modeled annual energy yield; it is not a guaranteed result or a live PVWatts report.
| Option | Example household fit | Representative location | System size | Approx. roof area | Modeled yield | Estimated annual output |
|---|---|---|---|---|---|---|
| 1. Compact rooftop array | Smaller home or partial daytime electricity use | Phoenix, Arizona | 5.0 kW | 325–400 sq ft | 1,820 kWh/kW-year | 9,100 kWh |
| 2. Balanced home system | Moderate electricity use with a suitable sunny roof | Los Angeles, California | 6.0 kW | 390–480 sq ft | 1,550 kWh/kW-year | 9,300 kWh |
| 3. High-sun family system | Family home with above-average daytime loads | Denver, Colorado | 7.0 kW | 455–560 sq ft | 1,580 kWh/kW-year | 11,060 kWh |
| 4. Larger Midwest array | Higher-use home with electric appliances or cooling | Chicago, Illinois | 8.0 kW | 520–640 sq ft | 1,320 kWh/kW-year | 10,560 kWh |
| 5. Northeast household array | Typical home with a clear, mostly south-facing roof | Boston, Massachusetts | 8.0 kW | 520–640 sq ft | 1,380 kWh/kW-year | 11,040 kWh |
| 6. Space-efficient Northwest array | Home with lower annual use or limited unshaded roof space | Seattle, Washington | 9.0 kW | 585–720 sq ft | 1,180 kWh/kW-year | 10,620 kWh |
| 7. High-output warm-climate array | Larger household or home with substantial cooling demand | Miami, Florida | 10.0 kW | 650–800 sq ft | 1,620 kWh/kW-year | 16,200 kWh |
Modeling basis: Illustrative fixed-roof PVWatts-style estimates use representative location resource, a south-facing array, a roof tilt near local latitude, a 1.2 DC-to-AC ratio, and 14% system losses. Roof-area ranges allow for spacing and access and assume roughly 65–80 square feet per installed kilowatt. Actual annual production depends on the precise address, roof orientation and tilt, shading, weather, equipment, and system design; use the NREL PVWatts calculator with project-specific inputs for a site estimate.
For a 2026 home solar shortlist, use NREL’s 2023 residential PV estimate of $2.90 per watt of direct-current capacity as a reference point, not a guaranteed quote. At that rate, an 8-kilowatt system pencils out to about $23,200 before incentives and financing costs. The estimate helps compare cash-purchase rooftop systems with leased or power-purchase options, but check what each quote includes. Roof work, electrical upgrades, and local labor can shift the total.
NREL’s benchmark is a modeled estimate, so it cannot capture every home’s conditions. A shaded roof may need different equipment or a smaller array. Battery storage also changes the comparison: price the solar array and battery separately, then ask how much backup power the battery provides. SEIA and Wood Mackenzie reported that U.S. residential solar installations fell 31% in 2024. That market shift is useful context, though it does not predict your local 2026 price.
Tips: Divide the quoted cash price by system size in watts DC. Compare that figure with $2.90/Wdc, then inspect the equipment, labor, and warranty details. Small caveat: quotes may use different assumptions, so the calculation is only a starting point.
As electricity costs continue rising, many small households in Maharashtra seek sustainabl...Read More
Uttar Pradesh is making significant progress in adopting renewable energy, particularly so...Read More
With the Indian government actively promoting renewable energy through subsidies and polic...Read More
Tired of watching your electricity bills climb month after month and strain your pockets? ...Read More
Switching to solar energy in Gujarat has never been more profitable! With plenty of sunlig...Read More
If you live in Madhya Pradesh and want to save money on power while living a greener lifes...Read More
If you’re a resident of Bangalore looking to save on your skyrocketing electricity b...Read More
If you live in Karnataka and have been looking for an environmentally friendly, cost-effec...Read More
Delhi is a city that thrives on its vibrant energy, and what better way to complement that...Read More
As electricity costs continue rising, many small households in Maharashtra seek ...Read More
Uttar Pradesh is making significant progress in adopting renewable energy, parti...Read More
With the Indian government actively promoting renewable energy through subsidies...Read More